Stream Website Visits to Power BI using Azure Stream Analytics
In this post, I will show how to setup Azure Stream Analytics to process visits from web site in real time and show results in Power BI.Setup Azure Stream Analytics
Login to https://manage.windowsazure.com
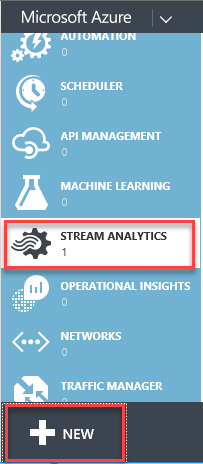
Select Stream Analytics -> NEW -> Quick Create
Click Create Stream Analytics Job.

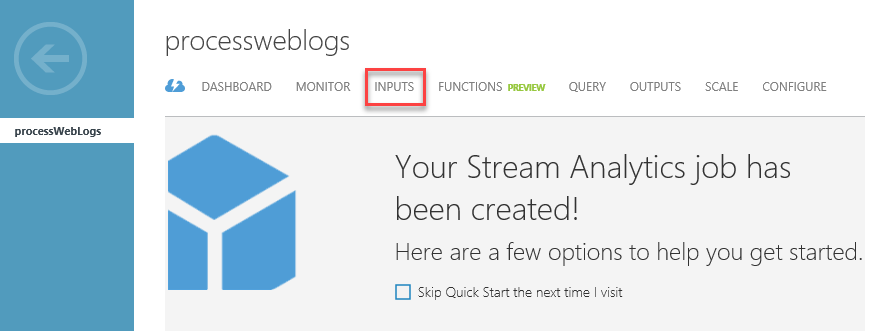
When deployment is finished, click on the job name.

Go to INPUTS
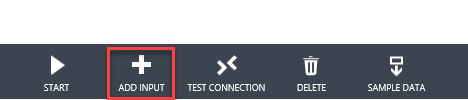
Click ADD INPUT
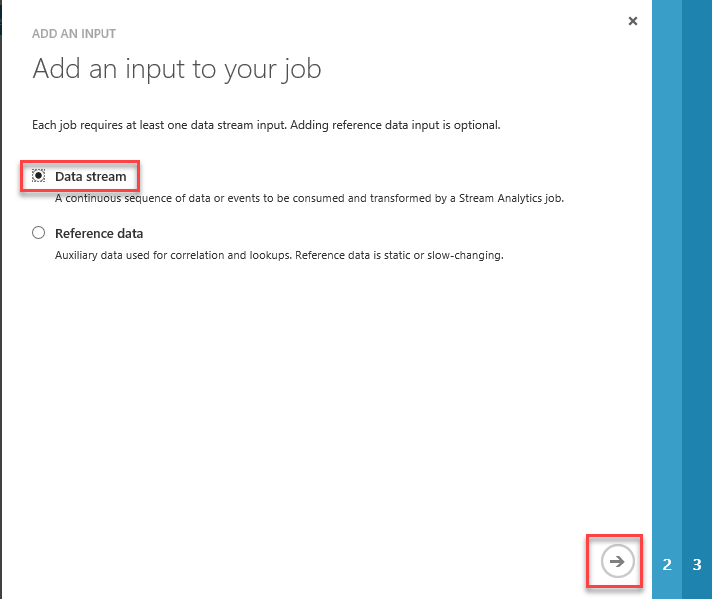
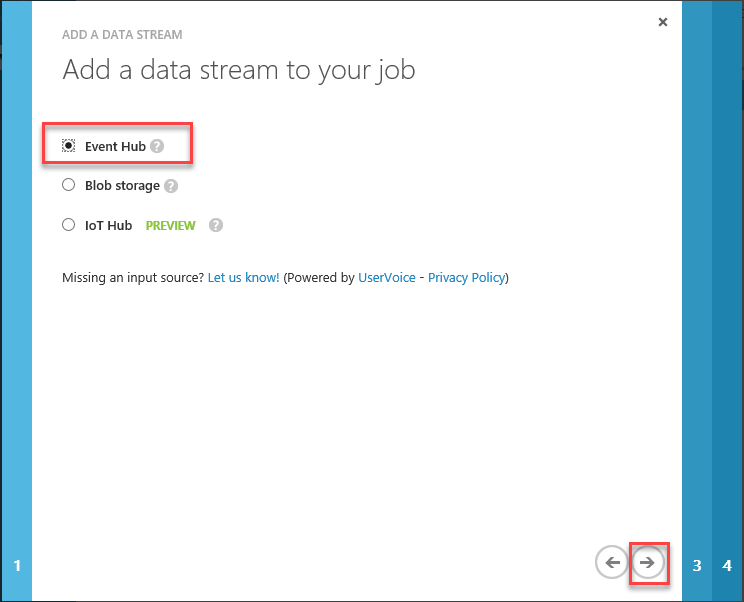
Select Data stream
Event Hub
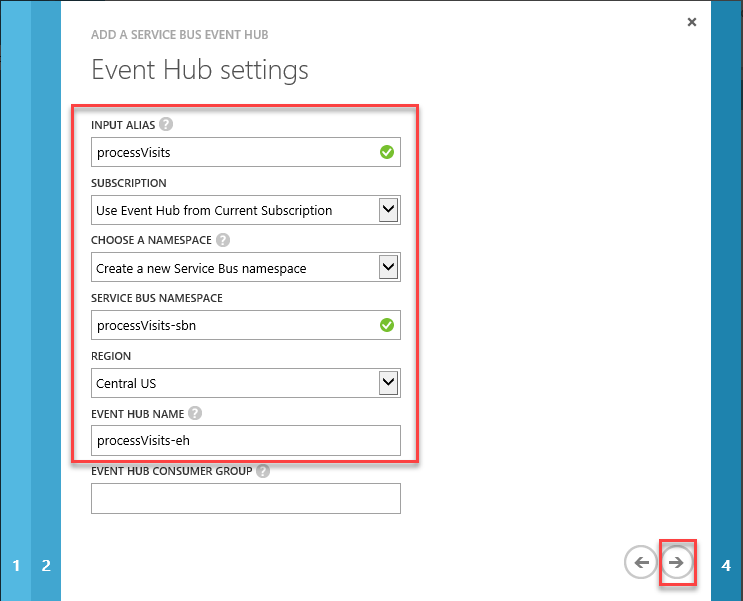
Enter Input Alias, Service Bus Namespace
Select Region and enter Event Hub Name
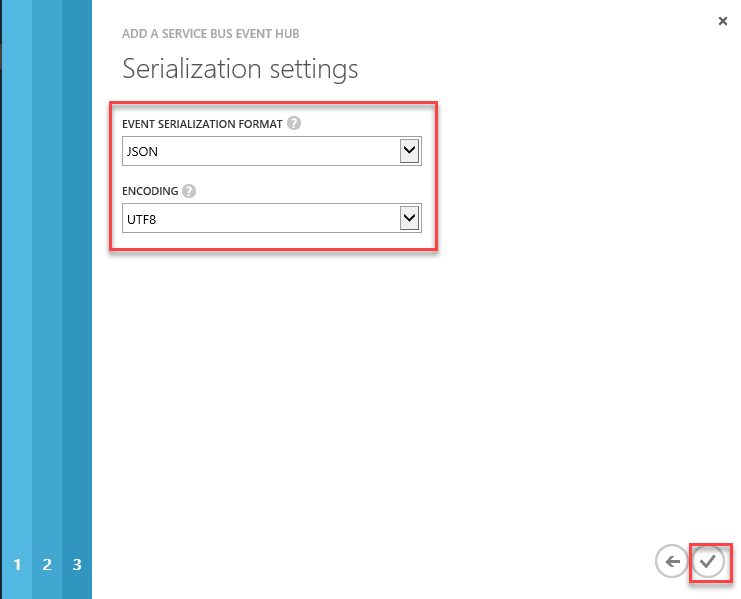
Select JSON as Event Serialization Format and UTF8 as Encoding
Confirm
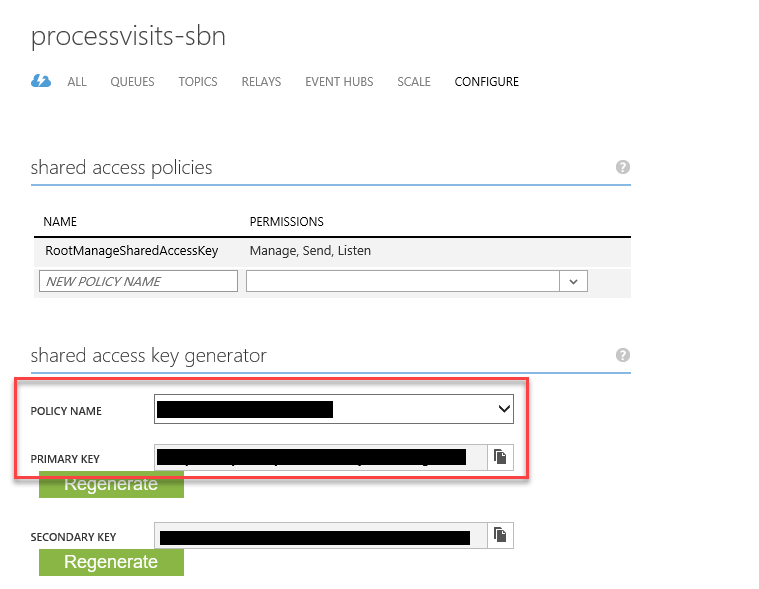
When deployed, go to Service Bus. (Note the namespace – we are going to need this later). Click on the namespace.
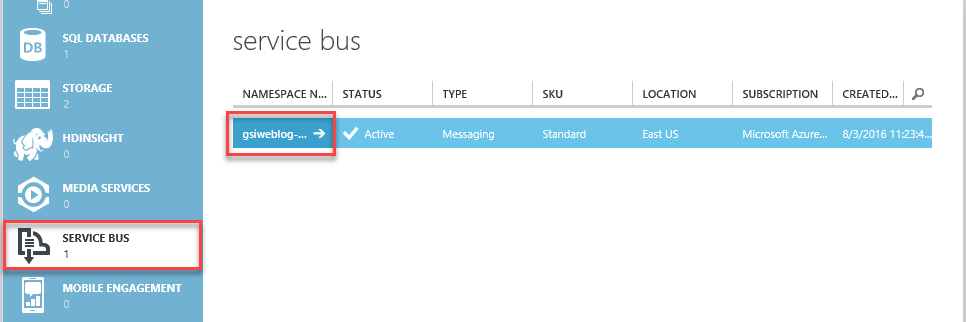
Click CONFIGURE – note policy name and primary key – we are going to need this later).
Send Visits to Event Hub
You can choose from few SDKs supporting Service Bus, such as: .NET, Java, Node.js, etc.
For more information, visit:
https://azure.microsoft.com/en-us/documentation/articles/service-bus-dotnet-get-started-with-queues/
For simplicity, in our example I used JavaScript. (Since we have to enter all information regarding connection to our Event Hub to the JavaScript, I don’t recommend to use this method for public websites).
Here is the link to JS SDK:
https://github.com/ddobric/ServiceBusJavaScriptSdk/wiki/Welcome-to-Azure-Service-Bus-JavaScript-SDK-1.2
Here is the example of simple html file that will send all information about a visit every time someone opens the web site. (as the base, I used the ServiceBusSample app that comes with JS SDK).
<!DOCTYPE HTML PUBLIC "-//W3C//DTD HTML 4.01 Transitional//EN" "http://www.w3.org/TR/html4/loose.dtd">
<html>
<head>
   <title>Welcome Test Page</title>
   <link rel="stylesheet" href="css/qunit-git.css" type="text/css" />
   <link rel="stylesheet" href="css/main.css" type="text/css" />
   <script type="text/javascript" src="http://code.jquery.com/jquery-latest.js"> </script>
   <script src="Scripts/servicebusjssdk-1.2.min.js"></script>
   <link rel="stylesheet" href="css/shCore.css" type="text/css" />
   <link rel="stylesheet" href="css/shThemeEclipse.css" type="text/css" />
   <script src="Scripts/shCore.js"></script>
   <script type="text/javascript" src="Scripts/shBrushJScript.js"></script>
   <script type="text/javascript">
       $(document).ready(function () {
           var queuePath = "<enter event hub name>";
           var ehClient = new EventHubClient(
           {
               'name': queuePath,
               'devicename': 'jsweblog',
               'namespace': "<enter you Event Hub namespace",
               'sasKey': "<enter primary key",
               'sasKeyName': "<enter policy name",
               'timeOut': 10,
           });

           $.get("http://ipinfo.io", function (response) {
               var d = (new Date).toISOString().replace(/z|t/gi, ' ').trim();
               var location = ""
               if (response.region == "") {
                   location = response.city + ", " + response.country;
               } else {
                   location = response.city + ", " + response.region + ", " + response.country;
               }
               var eventBody = { "logdate": d, "ip": response.ip, "country": response.country, "city": response.city, "region": response.region, "location": location };
               var msg = new EventData(eventBody);

              ehClient.sendMessage(msg, function (messagingResult) {
                   $("#result").html(messagingResult.result);
                   $("#eventData").html(JSON.stringify(eventBody));
               });
           }, "jsonp");
       });
   </script>
</head>
<body>
   <section class="container ">
       <h1 id="qunit-header" class="sample-page-title">Welcome !!</h1>
       <h2 id="qunit-banner" />
       <div class="inner-wrapper">
           <div class="message-wrapper">
               <p>Event Data:</p>
               <div id="eventData">
               </div><br />
               <p>Message Body:</p>
               <div id="result">
               </div><br />
           </div>
       </div>
   </section>
</body>
</html>
When you open this page, you will see something like that:
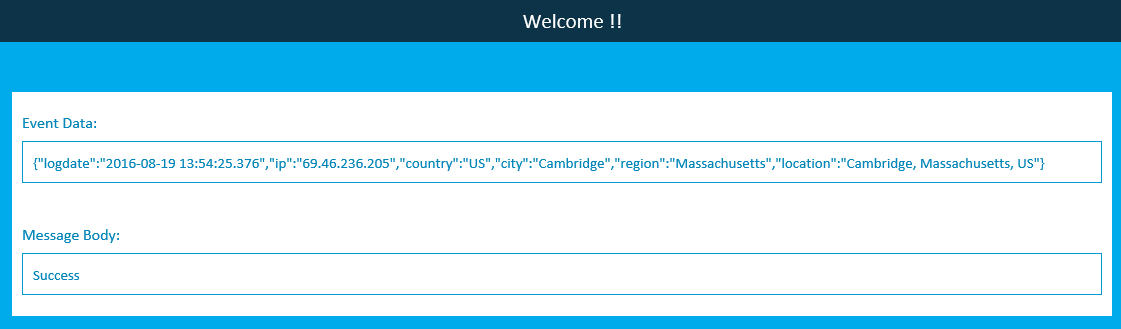
Event Data is the string in JSON format that was sent to Event Hub
Message Body: It is the status return from Event Hub.
Configure Azure Stream Analytics
Outputs
Go back to Stream Analytics and click OUTPUTS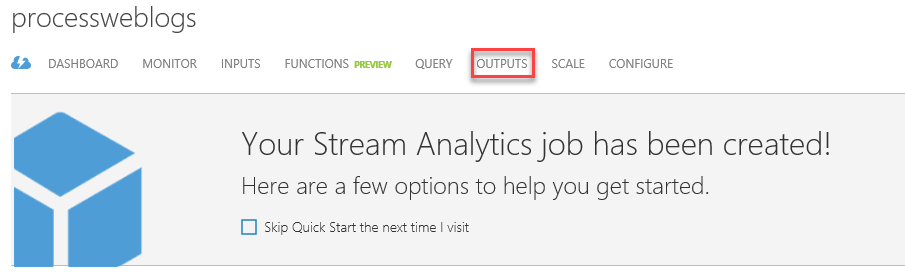
Click ADD OUTPUT

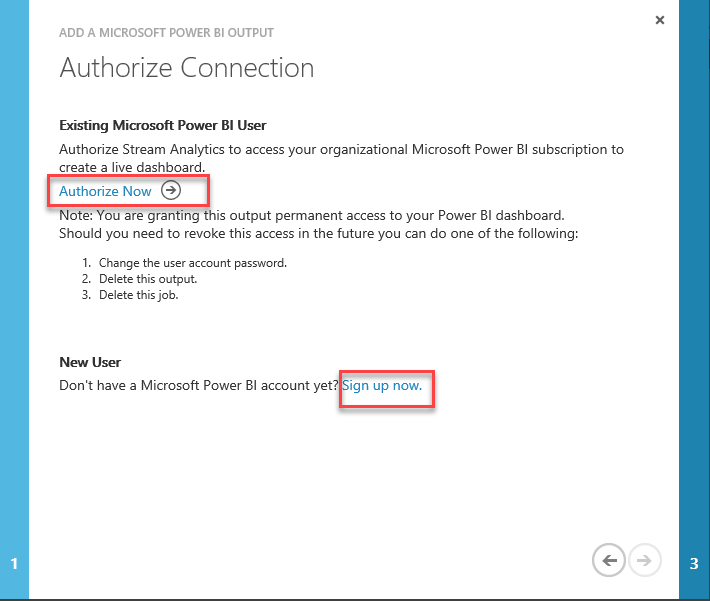
Select Power BI
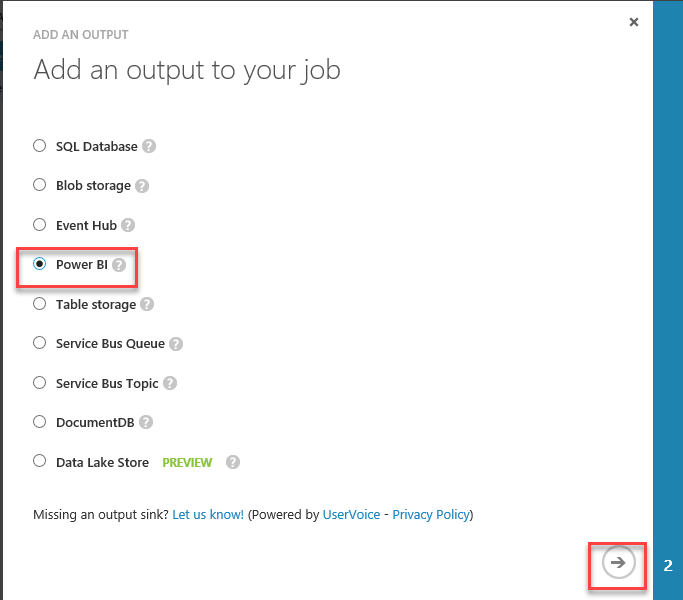
Click “Authorize Now” or “Sign up now” to create new Power BI account.
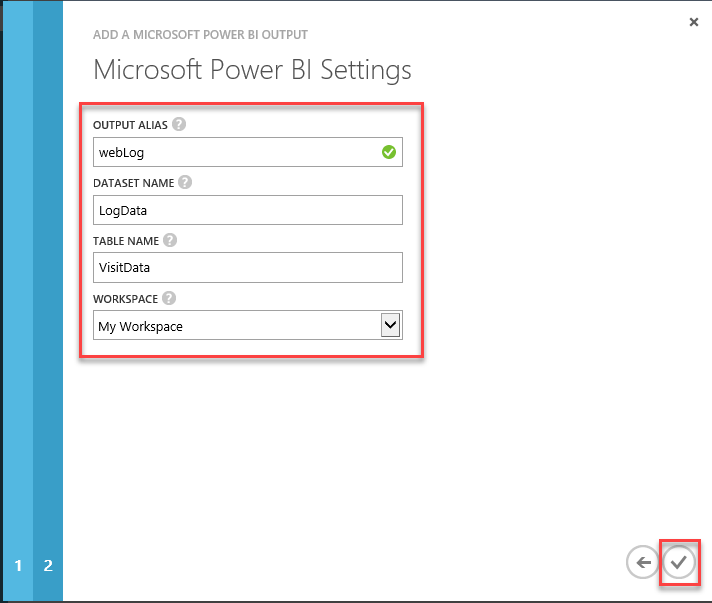
Fill out all information and confirm
Query
Click QUERY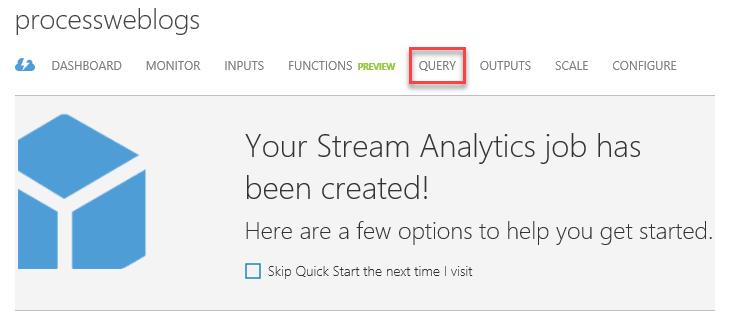
Stream Analytics is using subset of T-SQL language to query data.
For more information, visit: https://manage.windowsazure.com
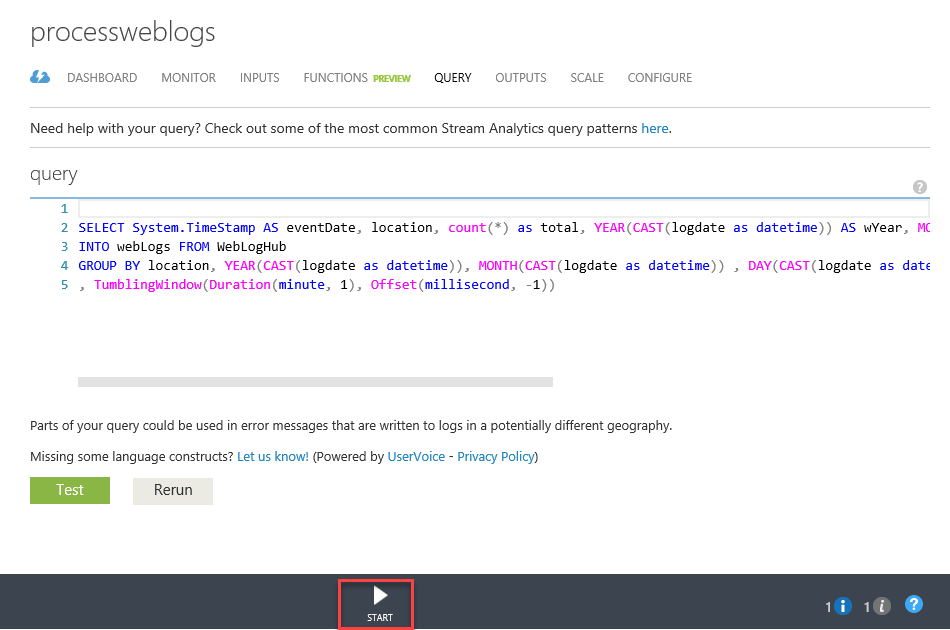
Here is the query I used in our example:
SELECT System.TimeStamp AS eventDate, location, count(*) as total, YEAR(CAST(logdate as datetime)) AS wYear, MONTH(CAST(logdate as datetime)) AS wMonth, DAY(CAST(logdate as datetime)) AS wDay
INTO webLog FROM WebLogHub
GROUP BY location, YEAR(CAST(logdate as datetime)), MONTH(CAST(logdate as datetime)) , DAY(CAST(logdate as datetime))
, TumblingWindow(Duration(minute, 1), Offset(millisecond, -1))
FROM – the name of our inputINTO – the name of our output. This can be skipped if you have only one output.
Click Start
Power BI
Login to https://app.powerbi.com
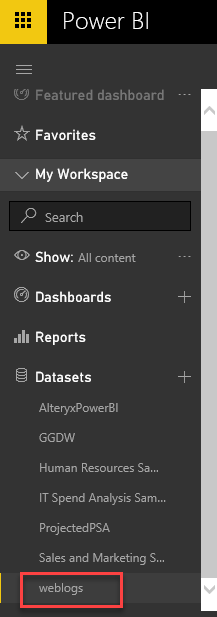
You should see your new data set. Click on it.
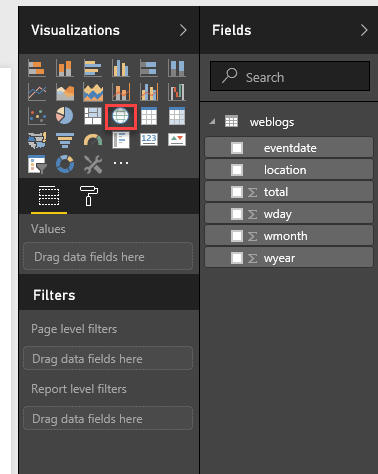
From the Visualizations, click on Map
Drag location and drop to Location, and total to Size and Color Saturation.
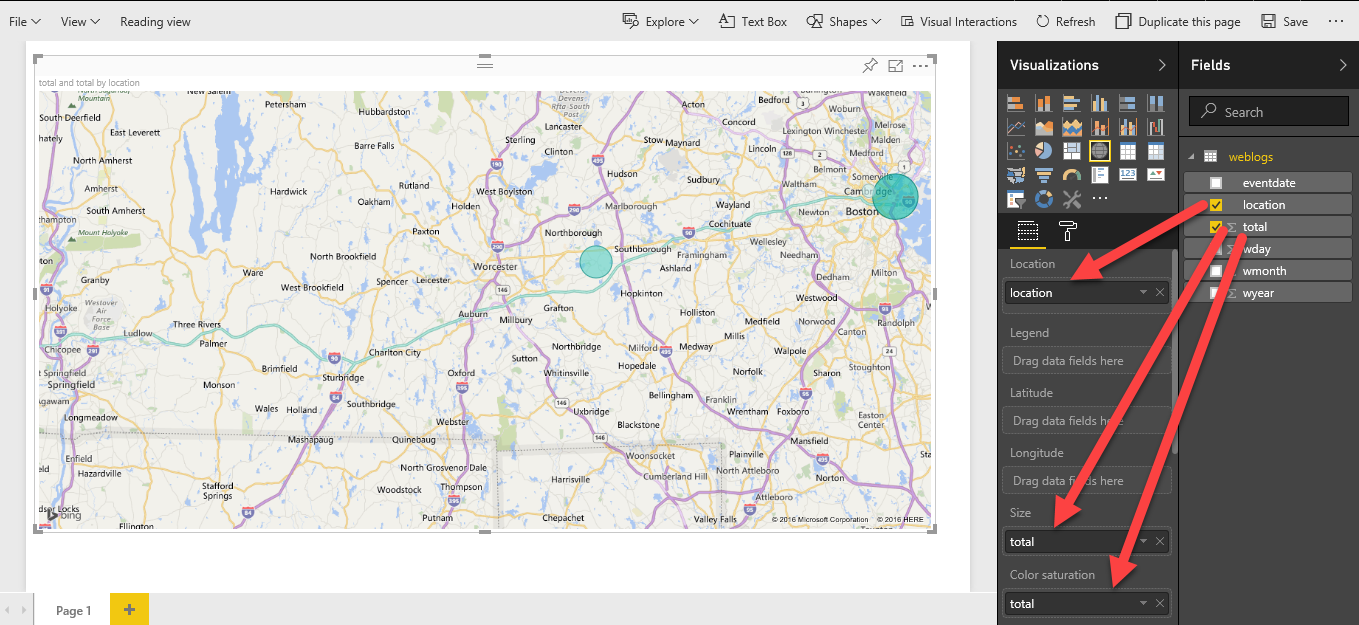
Save as new report.
Done.
Super information providing by you, Keep share and update Azure Online Training Bangalore
ReplyDelete